python画log图
发布时间:2019-09-07 08:06:06编辑:auto阅读(3748)
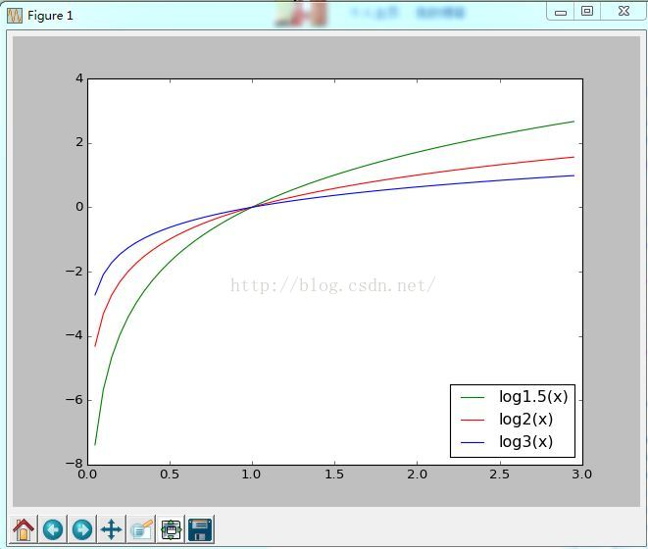
1、用python画出log1.5(x),log(2x),log(3x)
import numpy as np
import math
import matplotlib.pyplot as plt
x=np.arange(0.05,3,0.05)
y1=[math.log(a,1.5)for a in x]
y2=[math.log(a,2)for a in x]
y3=[math.log(a,3)for a in x]
plot1=plt.plot(x,y1,'-g',label="log1.5(x)")
plot2=plt.plot(x,y2,'-r',label="log2(x)")
plot3=plt.plot(x,y3,'-b',label="log3(x)")
plt.legend(loc='lower right')
plt.show()
2、输出结果
上一篇: Python的io模块详解
下一篇: 用python记录运行pid,并在需要时
- H3C基本命令大全
53520
- H3C IRF原理及 配置
40348
- Python exit()函数
34749
- python全系列官方中文文档
30506
- python 获取网卡实时流量
25382
- 1.常用turtle功能函数
25180
- python 获取Linux和Windows硬件信息
23592
- 天天基金网数据接口
18862
- Selenium使用代理IP&无头模式访问网站
15171
- Selenium&Pytesseract模拟登录+验证码识别
14679
- LangGraph Studio可视化
1147°
- LangSmith开发-应用入门
1069°
- LangGraph开发-多轮对话问答机器人
1140°
- LangGraph开发-条件分支/循环图实战
1155°
- LangGraph开发-生态介绍,入门demo实战
1189°
- LangChain-接入12306-HTTP MCP智能体
1347°
- LangChain接入自定义爬虫-MCP工具
1307°
- LangChain接入Filesystem-MCP工具
1280°
- LangChain搭建MCP服务端和客户端流程
1379°
- LangGraph与MCP技术概述
1321°
- 姓名:Run
- 职业:谜
- 邮箱:383697894@qq.com
- 定位:上海 · 松江