Python绘制三维图形
发布时间:2019-09-24 08:29:45编辑:auto阅读(2867)
需要安装numpy和matplotlib库,我都是pip库安装,这样比较简单。
import numpy as np
import matplotlib.pyplot as plt
import mpl_toolkits.mplot3d
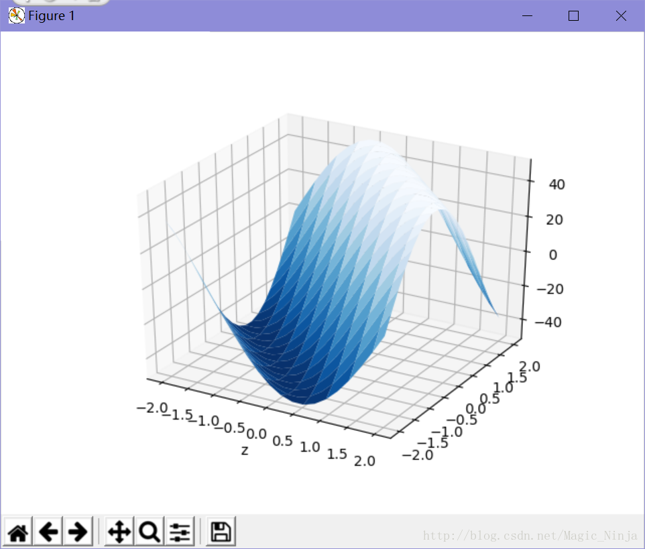
x, y = np.mgrid[-2 : 2 : 20j, -2 : 2 : 20j]
z = 50 * np.sin(x + y) # 测试数据
ax = plt.subplot(111, projection = '3d') # 三维图形
ax.plot_surface(x, y, z, rstride = 2, cstride = 1, cmap = plt.cm.Blues_r)
ax.set_xlabel('x') # 设置坐标轴标签
ax.set_xlabel('y')
ax.set_xlabel('z')
plt.show()这是最终效果
参考自《Python可以这样学》414页
上一篇: Python学习:使用urllib模块读
下一篇: Python中数组的几种使用方法
- H3C基本命令大全
53552
- H3C IRF原理及 配置
40375
- Python exit()函数
34781
- python全系列官方中文文档
30536
- python 获取网卡实时流量
25420
- 1.常用turtle功能函数
25204
- python 获取Linux和Windows硬件信息
23626
- 天天基金网数据接口
18933
- Selenium使用代理IP&无头模式访问网站
15203
- Selenium&Pytesseract模拟登录+验证码识别
14709
- LangGraph Studio可视化
1178°
- LangSmith开发-应用入门
1104°
- LangGraph开发-多轮对话问答机器人
1165°
- LangGraph开发-条件分支/循环图实战
1188°
- LangGraph开发-生态介绍,入门demo实战
1225°
- LangChain-接入12306-HTTP MCP智能体
1378°
- LangChain接入自定义爬虫-MCP工具
1335°
- LangChain接入Filesystem-MCP工具
1301°
- LangChain搭建MCP服务端和客户端流程
1410°
- LangGraph与MCP技术概述
1347°
- 姓名:Run
- 职业:谜
- 邮箱:383697894@qq.com
- 定位:上海 · 松江