python绘图入门
发布时间:2019-09-15 10:10:38编辑:auto阅读(2956)
1. 系统环境
系 统 :CentOS 6.7 64位
python : 2.6.6 (系统自带)
IDE :pycharm 社区版
2. 搭建绘图环境
#yum install python-matplotlib
3. 画图
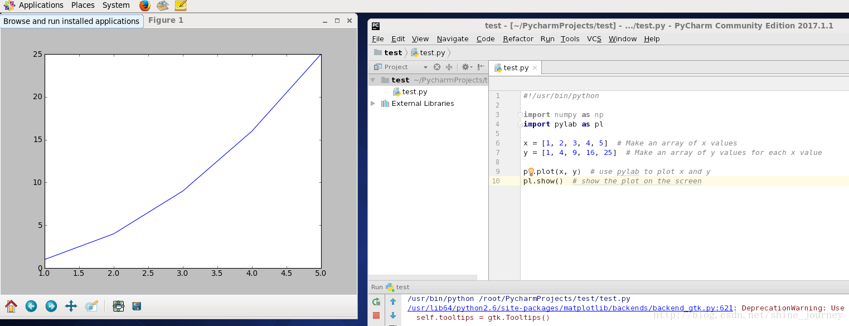
第一个例子,很经典,画点线图
代码如下:
#!/usr/bin/python

import numpy as np
import pylab as pl

x = [1, 2, 3, 4, 5]  # Make an array of x values
y = [1, 4, 9, 16, 25]  # Make an array of y values for each x value

pl.plot(x, y)  # use pylab to plot x and y
pl.show()  # show the plot on the screen
效果如图:

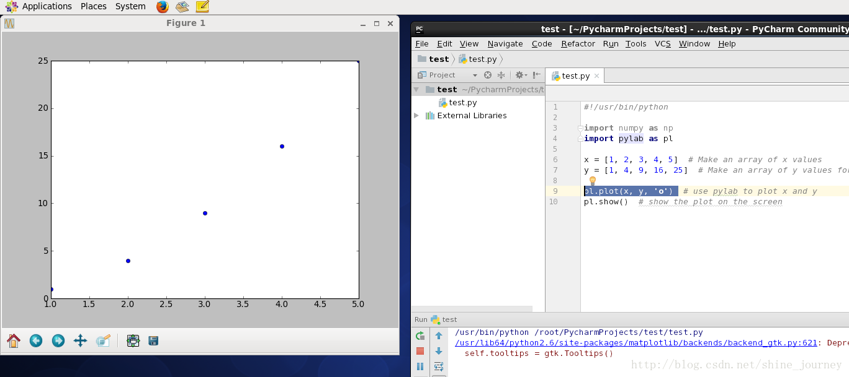
将pl.plot(x, y) 改为 pl.plot(x, y, 'o') ,可得到下面的图:

-------------------------------------------------
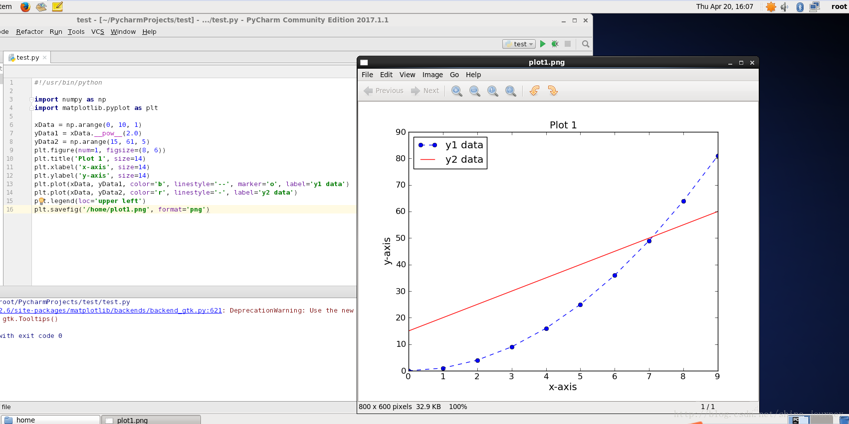
第二个例子,代码如下:
#!/usr/bin/python

import numpy as np
import matplotlib.pyplot as plt

xData = np.arange(0, 10, 1)
yData1 = xData.__pow__(2.0)
yData2 = np.arange(15, 61, 5)
plt.figure(num=1, figsize=(8, 6))
plt.title('Plot 1', size=14)
plt.xlabel('x-axis', size=14)
plt.ylabel('y-axis', size=14)
plt.plot(xData, yData1, color='b', linestyle='--', marker='o', label='y1 data')
plt.plot(xData, yData2, color='r', linestyle='-', label='y2 data')
plt.legend(loc='upper left')
plt.savefig('/home/plot1.png', format='png')
效果如下图:

----------------------------------------------------------
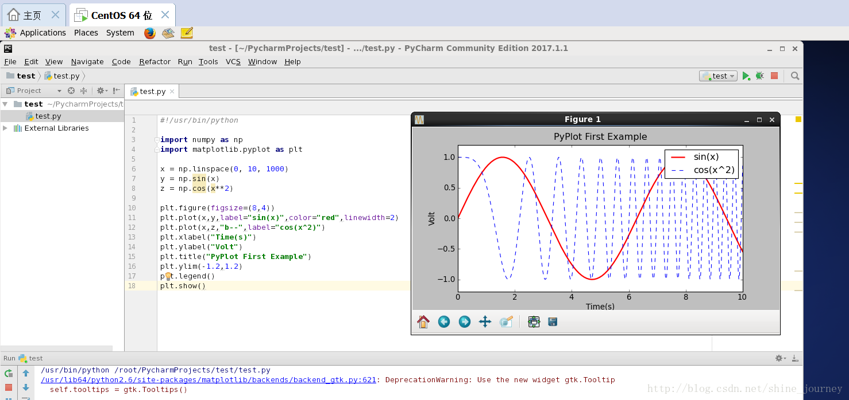
第三个例子,代码如下
#!/usr/bin/python

import numpy as np
import matplotlib.pyplot as plt

x = np.linspace(0, 10, 1000)
y = np.sin(x)
z = np.cos(x**2)

plt.figure(figsize=(8,4))
plt.plot(x,y,label="sin(x)",color="red",linewidth=2)
plt.plot(x,z,"b--",label="cos(x^2)")
plt.xlabel("Time(s)")
plt.ylabel("Volt")
plt.title("PyPlot First Example")
plt.ylim(-1.2,1.2)
plt.legend()
plt.show()
效果如下图:

4. 参考文献
[1] http://www.jb51.net/article/67626.htm
[2] http://old.sebug.net/paper/books/scipydoc/matplotlib_intro.html
[3] http://www.cnblogs.com/wei-li/archive/2012/05/23/2506940.html
---
上一篇: Python下三级菜单实现
下一篇: Python/NodeJS坑记
- openvpn linux客户端使用
52061
- H3C基本命令大全
51930
- openvpn windows客户端使用
42154
- H3C IRF原理及 配置
38996
- Python exit()函数
33499
- openvpn mac客户端使用
30450
- python全系列官方中文文档
29085
- python 获取网卡实时流量
24118
- 1.常用turtle功能函数
24023
- python 获取Linux和Windows硬件信息
22373
- LangChain1.0-Agent-部署/上线(开发人员必备)
133°
- LangChain1.0-Agent-Spider实战(爬虫函数替代API接口)
158°
- LangChain1.0-Agent(进阶)本地模型+Playwright实现网页自动化操作
169°
- LangChain1.0-Agent记忆管理
153°
- LangChain1.0-Agent接入自定义工具与React循环
178°
- LangChain1.0-Agent开发流程
163°
- LangChain1.0调用vllm本地部署qwen模型
185°
- LangChain-1.0入门实践-搭建流式响应的多轮问答机器人
195°
- LangChain-1.0入门实战-1
197°
- LangChain-1.0教程-(介绍,模型接入)
207°
- 姓名:Run
- 职业:谜
- 邮箱:383697894@qq.com
- 定位:上海 · 松江
