python3-PIL二值化
发布时间:2021-09-13 23:44:59编辑:run阅读(8713)
这是一种点操作,通过将阀值以下的所有像素变为0,阀值以上的所有像素变为1,从灰度级的图像创建二值图像。如果g(x,y)是f(x,y)在全局阀值T处的二值函数,则可以表示为:g(x,y)=1,f(x,y)>T 0,其他.
为什么需要转化为二值图像?主要是这样一些原因:可能对将图像分为前景和背景感兴趣;图像需要用黑白打印机打印出来(所有灰色阴影只需要用黑白圆点表示);需要用形态学操作对图像进行预处理,等等。
固定阀值的二值化,使用PIL的point()函数以固定阀值进行二值化处理。
from PIL import Image
import matplotlib.pylab as pylab
import numpy as np

pylab.rcParams['font.sans-serif'] = ['KaiTi']
pylab.rcParams['axes.unicode_minus'] = False
im = Image.open(r'D:\image_processing\image4\4.jpg').convert('L')
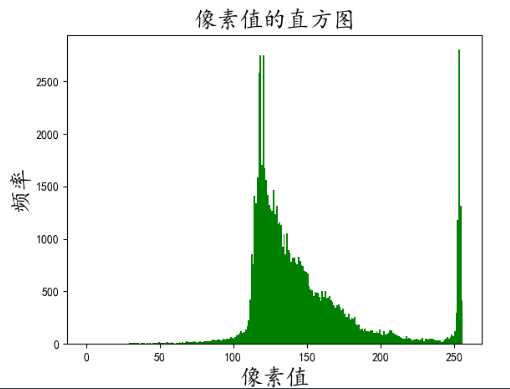
pylab.hist(np.array(im).ravel(), bins=256, range=(0, 256), color='g')
pylab.xlabel('像素值', size=20)
pylab.ylabel('频率', size=20)
pylab.title('像素值的直方图', size=20)
pylab.show()
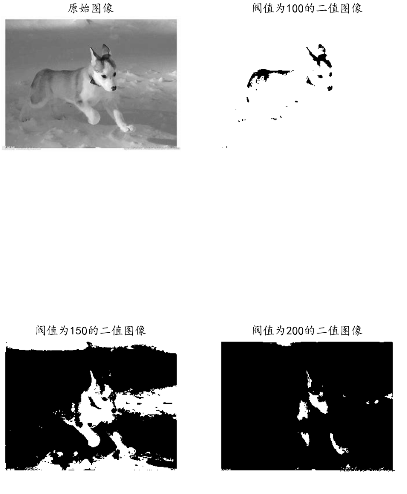
阀值不同的效果,不同灰度阀值的二值图像的阴影处理不得当,导致了人工痕迹显著的伪轮廓。
from PIL import Image
import matplotlib.pylab as pylab
import numpy as np

pylab.rcParams['font.sans-serif'] = ['KaiTi']
pylab.rcParams['axes.unicode_minus'] = False
def plot_image(image, title=''):
    pylab.title(title, size=20)
    pylab.imshow(image)
    pylab.axis('off')
im = Image.open(r'D:\image_processing\image4\4.jpg').convert('L')
pylab.hist(np.array(im).ravel(), bins=256, range=(0, 256), color='g')
pylab.xlabel('像素值', size=20)
pylab.ylabel('频率', size=20)
pylab.title('像素值的直方图', size=20)
pylab.show()
pylab.figure(figsize=(12, 18))
pylab.gray()
pylab.subplot(221)
plot_image(im, '原始图像')
th = [0, 50, 100, 150, 200]
for i in range(2, 5):
    im1 = im.point(lambda x:x > th[i])
    pylab.subplot(2, 2, i)
    plot_image(im1, f'阀值为{str(th[i])}的二值图像')
pylab.show()
半色调二值化,在阀值化(二值化)中,一种减少伪轮廓的方法是在量化前对输入图像加入均匀分布的白噪声。具体的做法是,对于灰度图像的每个输入像素f(x,y),添加一个独立的均匀分布于[-128,128]内的随机数,然后进行二值化处理,这种技术称为半色调二值化.
from PIL import Image
import matplotlib.pylab as pylab
import numpy as np

pylab.rcParams['font.sans-serif'] = ['KaiTi']
pylab.rcParams['axes.unicode_minus'] = False
def plot_image(image, title=''):
    pylab.title(title, size=20)
    pylab.imshow(image)
    pylab.axis('off')
im = Image.open(r'D:\image_processing\image4\4.jpg').convert('L')
im = Image.fromarray(np.clip(im + np.random.randint(-128, 128,
(im.height, im.width)), 0, 255).astype(np.uint8))
pylab.figure(figsize=(20, 15))
pylab.subplot(221)
plot_image(im, "带有噪声的原始图像")
th = [0, 50, 100, 150, 200]
for i in range(2, 5):
    im1 = im.point(lambda x:x > th[i])
    pylab.subplot(2, 2, i)
    plot_image(im1, f'阀值为{str(th[i])}的二值图像')
pylab.show()
基于误差扩散的Floyd-Steinberg抖动。为了防止大尺度的图样模式(如伪轮廓)的出现,我们特意采用一种噪声应用形式来随机量化误差,这个过程称为抖动。Floyd-Steinberg算法使用误差扩散技术来实现抖动,将像素的剩余量化误差推加到相邻像素上,再做处理。
该算法从左到右,从上到下扫描图像,依法对像素值进行量化,每次量化误差分布在相邻的像素之间(待扫描),而不影响已经量化的像素。因此,如果对多个像素向下取整,那么接下来的像素更有可能被算法向上取整,从而使得平均量化误差接近于零。
import cv2
import numpy as np
import matplotlib.pyplot as plt

plt.rcParams['font.sans-serif'] = ['KaiTi'] # 指定默认字体
plt.rcParams['axes.unicode_minus'] = False # 解决保存图像是负号'-'显示为方块的问题

img_gray0 = cv2.imread(r"D:\image_processing\image4\4.jpg", cv2.IMREAD_GRAYSCALE)
img_gray0 = 255 - img_gray0
h, w= img_gray0.shape

img_gray0 = cv2.resize(img_gray0, (w//2, h//2))

h, w= img_gray0.shape
pylab.figure(figsize=(20, 15))
plt.subplot(221)
plt.imshow(img_gray0, vmin=0, vmax=255, cmap=plt.get_cmap("Greys"))
plt.title("原始图像", size=25)

img_gray_eq = img_gray0

img_dither = np.zeros((h+1, w+1), dtype=np.float)
img_undither = np.zeros((h, w), dtype=np.uint8)

threshold = 128

for i in range(h):
    for j in range(w):
        img_dither[i, j] = img_gray_eq[i, j]
        if img_gray_eq[i, j] > threshold:
            img_undither[i, j] = 255

for i in range(h):
    for j in range(w):
        old_pix = img_dither[i, j]
        if (img_dither[i, j] > threshold):
            new_pix = 255
        else:
            new_pix = 0

        img_dither[i, j] = new_pix

        quant_err = old_pix - new_pix

        if j > 0:
            img_dither[i+1, j-1] = img_dither[i+1, j-1] + quant_err * 3 / 16
        img_dither[i+1, j] = img_dither[i+1, j] + quant_err * 5 / 16
        img_dither[i, j+1] = img_dither[i, j+1] + quant_err * 7 / 16
        img_dither[i+1, j+1] = img_dither[i+1, j+1] + quant_err * 1 / 16

img_dither = img_dither.astype(np.uint8)
img_dither = img_dither[0:h, 0:w]

plt.subplot(222)
plt.imshow(img_dither, vmin=0, vmax=255, cmap=plt.get_cmap("Greys"))
plt.title("半色调二值化图像", size=25)
plt.subplot(223)
plt.imshow(img_undither, vmin=0, vmax=255, cmap=plt.get_cmap("Greys"))
plt.title("经Floyd-Steinberg算法处理后的二值图像", size=25)

plt.show()
- openvpn linux客户端使用
49202
- H3C基本命令大全
48360
- openvpn windows客户端使用
39083
- H3C IRF原理及 配置
36193
- Python exit()函数
30602
- openvpn mac客户端使用
27406
- python全系列官方中文文档
26397
- 1.常用turtle功能函数
21233
- python 获取网卡实时流量
21074
- python 获取Linux和Windows硬件信息
19415
- LLaMA Factory微调后的模型合并导出和部署-4
223°
- LLaMA Factory微调模型的各种参数怎么设置-3
225°
- LLaMA Factory构建高质量数据集-2
339°
- MinerU-linux环境本地部署
549°
- LLaMA Factory安装和基本使用-1
372°
- 使用ms-swift基于Qwen3-8B微调小说模型
1066°
- pythonp爬虫-fanqienovel字体反爬实战
1054°
- 大模型基础架构
1042°
- AI多模态- Janus-Pro-7B模型推理微调,融合实战2
1039°
- Selenium加载用户目录爬取某宝电商数据
993°
- 姓名:Run
- 职业:谜
- 邮箱:383697894@qq.com
- 定位:上海 · 松江
